


The HDL triglycerides ratio is a powerful health metric you get by dividing your triglyceride level by your high-density lipoprotein (HDL) level. It gives a far more insightful look into your metabolic health and future disease risk than just looking at 'good' or 'bad' cholesterol numbers on their own. For those focused on longevity, a lower ratio is always better.
Your Hidden Key to Longevity
For decades, we’ve been told to focus on 'good' (HDL) and 'bad' (LDL) cholesterol. And while those markers are certainly important, they don't paint the full picture. The HDL triglycerides ratio offers a much more revealing snapshot of your metabolic efficiency, acting as a important, yet often overlooked, biomarker for a long and healthy life.
Beyond Good and Bad Cholesterol
Let's use an analogy. Think of your body's lipid system like a city's waste disposal service. HDL cholesterol is your diligent cleanup crew, travelling through your arteries to collect excess fats and ferry them back to the liver for disposal. They are essential for maintaining a clean, efficient system that supports a long healthspan.
Triglycerides, on the other hand, are the 'rubbish' produced from excess energy - especially from sugars and refined carbohydrates. When triglyceride levels are high, it’s like the city is producing far too much waste for the cleanup crew to handle.
This is precisely where the HDL triglycerides ratio becomes so powerful for predicting longevity. A high ratio signals that your waste disposal system is overwhelmed; there's simply too much rubbish (triglycerides) for the cleanup crew (HDL) to manage. This imbalance is a major red flag for metabolic dysfunction, a key driver of age-related disease.
To give you a clear reference point, here are the target ranges most clinicians work with.
At-a-Glance HDL Triglycerides Ratio Ranges
This quick reference table summarises the different risk levels associated with the HDL triglycerides ratio, providing immediate context for your long-term health goals.
| Ratio (Triglycerides ÷ HDL) | Risk Level | What It Means for Longevity |
|---|---|---|
| Below 0.87 | Ideal | Indicates excellent metabolic health and a very low risk of cardiovascular events. This is the goal for optimal healthspan. |
| 0.87 – 1.74 | Good | Represents a low-risk profile. While good, there may be some room for lifestyle optimisation to further enhance longevity. |
| 1.74 – 2.62 | Borderline | Signals some underlying metabolic inefficiency. This is a important early warning to take proactive steps to protect your future health. |
| Above 2.62 | High Risk | A strong indicator of metabolic dysfunction and significantly increased risk for cardiovascular disease. Action is needed to improve long-term outcomes. |
Seeing your number in context makes it much easier to understand where you stand and what your next steps should be for a longer, healthier life.
The Link to Cardiovascular Health and Longevity
This isn't just a theoretical concept - it has profound, real-world consequences for your healthspan. When the ratio is poor, it often points to the presence of small, dense LDL particles. These are the truly dangerous type of cholesterol that can easily weasel their way into arterial walls, leading to the low-grade inflammation that accelerates aging.
A major analysis of the UK Biobank involving over 400,000 participants highlighted just how predictive this ratio is. Researchers found that individuals with the highest TG/HDL-C ratio had a 29% increased risk for total cardiovascular disease compared to those with the lowest ratio. This powerful data underscores why monitoring your ratio is a vital, actionable step towards a longer, healthier life. You can discover more about these striking cardiovascular risk findings and how they apply to the UK population.
By focusing on the relationship between triglycerides and HDL, you gain a clearer, more dynamic view of your metabolic efficiency and cardiovascular resilience - two cornerstones of longevity. It shifts the focus from static numbers to the functional health of your entire system.
Ultimately, understanding and optimising your HDL triglycerides ratio isn’t just about managing cholesterol. It’s about fine-tuning your body’s core metabolic processes to support vitality, slash disease risk, and lay the foundation for a longer, more vibrant life.
How Your Ratio Reveals Your Heart's True Story
Looking at your cholesterol numbers one by one gives you part of the picture, but the HDL to triglycerides ratio tells a much deeper, more predictive story about your heart's future. Think of it as an advanced diagnostic, revealing the hidden dynamics of your lipid system and flagging potential dangers long before they turn into a real problem. For anyone serious about extending their healthspan, getting a handle on this ratio is a significant advantage.
A poor ratio isn’t just a simple case of too many triglycerides or not enough HDL. It signals a fundamental shift in the quality of your cholesterol particles. Specifically, it’s a strong clue that your body is churning out too many small, dense LDL (sdLDL) particles - and these are the real troublemakers for long-term health.
The Problem with Small, Dense LDL
Imagine your arteries are busy motorways. Normal LDL particles are like cars, moving along fairly predictably. But small, dense LDL particles? They’re like rogue motorbikes, zipping through traffic and squeezing into tiny gaps where they don't belong.
Because they’re so small and aggressive, these sdLDL particles can easily wiggle their way into the delicate lining of your arteries (the endothelium) and get stuck. Once they're trapped inside the artery wall, they start to oxidise - a process a bit like metal beginning to rust. This oxidation triggers an inflammatory alarm bell, kicking off the process of plaque formation, which is the very foundation of atherosclerosis and a key process in aging.
- They sneak in easily: Their small size lets them slip through the arterial wall.
- They damage more readily: They’re more vulnerable to oxidation, which starts the plaque-building fire.
- They stick around for longer: They circulate in your bloodstream for a longer time, giving them more opportunity to cause harm.
A high triglycerides to HDL ratio is one of the most reliable signs that your system is overloaded with these harmful sdLDL particles. That's precisely why the ratio is such a useful measure for predicting and preventing future heart disease.
The Link to Inflammation and Stress
The story doesn't stop with plaque. When oxidised sdLDL particles build up in your artery walls, they send out distress signals that attract your immune cells. This creates a state of chronic, low-grade inflammation simmering away inside your blood vessels.
This constant, low-level fire is a major driver of cardiovascular disease and accelerated aging. It makes plaques unstable and more likely to break apart, which is what can at the end of the day lead to a heart attack or stroke. For anyone pursuing longevity, managing this underlying inflammation is critical. The daily stressors from work and intense physical exertion can fan these inflammatory flames, making it even more vital to keep an eye on metrics like your HDL to triglycerides ratio.
Your HDL to triglycerides ratio gives you a direct window into this inflammatory process. A high ratio suggests your cardiovascular system is under a lot of stress, even if you feel perfectly fine. It's an early warning system for the silent damage that chips away at your healthspan over time.
Why High HDL Alone Isn't the Answer
It’s a common myth that as long as your HDL cholesterol is high, you're in the clear. While a good HDL level is certainly a positive thing, its protective benefits can be completely cancelled out if your triglycerides are sky-high. This is where the context of the ratio becomes so important for longevity.
A fascinating piece of research from the UK Biobank, which looked at over 14,000 people with coronary artery disease, uncovered something startling. People with extremely high HDL levels (above 2.07 mmol/L) were, paradoxically, at a 96% greater risk of all-cause mortality. This points to the idea of "dysfunctional HDL," where the HDL particles simply aren't doing their cleanup job properly, often because they are overwhelmed by high triglycerides. As you can read in the full study about HDL function, triglycerides were a key piece of the puzzle. It proves that the balance between HDL and triglycerides, the ratio, is what really counts for predicting your health and longevity.
Decoding Your Blood Test Results
Getting your lab report back can feel a bit like trying to decipher a secret code. But hidden within those numbers is a powerful story about your health, and understanding your HDL:triglycerides ratio is like finding the key. It turns abstract data into a clear roadmap for action, especially when your goal is longevity. This simple calculation gives a much sharper picture of your metabolic health than looking at cholesterol numbers on their own.
Figuring out your ratio is refreshingly simple. Using the standard UK units (mmol/L), you just divide your triglyceride number by your HDL cholesterol number.
Triglycerides (mmol/L) ÷ HDL Cholesterol (mmol/L) = Your Ratio
For instance, if your triglycerides are 1.0 mmol/L and your HDL is 1.25 mmol/L, your ratio is 0.8. This one little number is the starting line for truly understanding your personal risk profile and optimising for a long life.
Interpreting Your Ratio for Longevity
Once you have your number, the next step is to see where it falls. Evidence-based ranges help you understand what it means for your long-term health, showing you whether your metabolic engine is purring along nicely or starting to show signs of strain.
Here are the key thresholds to keep in mind:
- Optimal (Below 0.87): This is the sweet spot for longevity. It points to excellent insulin sensitivity, minimal inflammation, and a very low risk of future cardiovascular problems.
- Low Risk (0.87 – 1.74): Still a great place to be, this range indicates a healthy metabolic profile. You’re generally in a low-risk category, though there might be small tweaks you could make to improve even further.
- Borderline High (1.74 – 2.62): Think of this as an early warning light on your dashboard. It suggests your body might be struggling with metabolic efficiency and is a prompt to take proactive steps before things progress.
- High Risk (Above 2.62): A ratio this high signals significant metabolic dysfunction. It’s a clear call to action, indicating a substantially increased risk for heart disease and insulin resistance.
This diagram helps visualise how a high HDL:triglycerides ratio contributes to some of the biggest risk factors for heart disease.
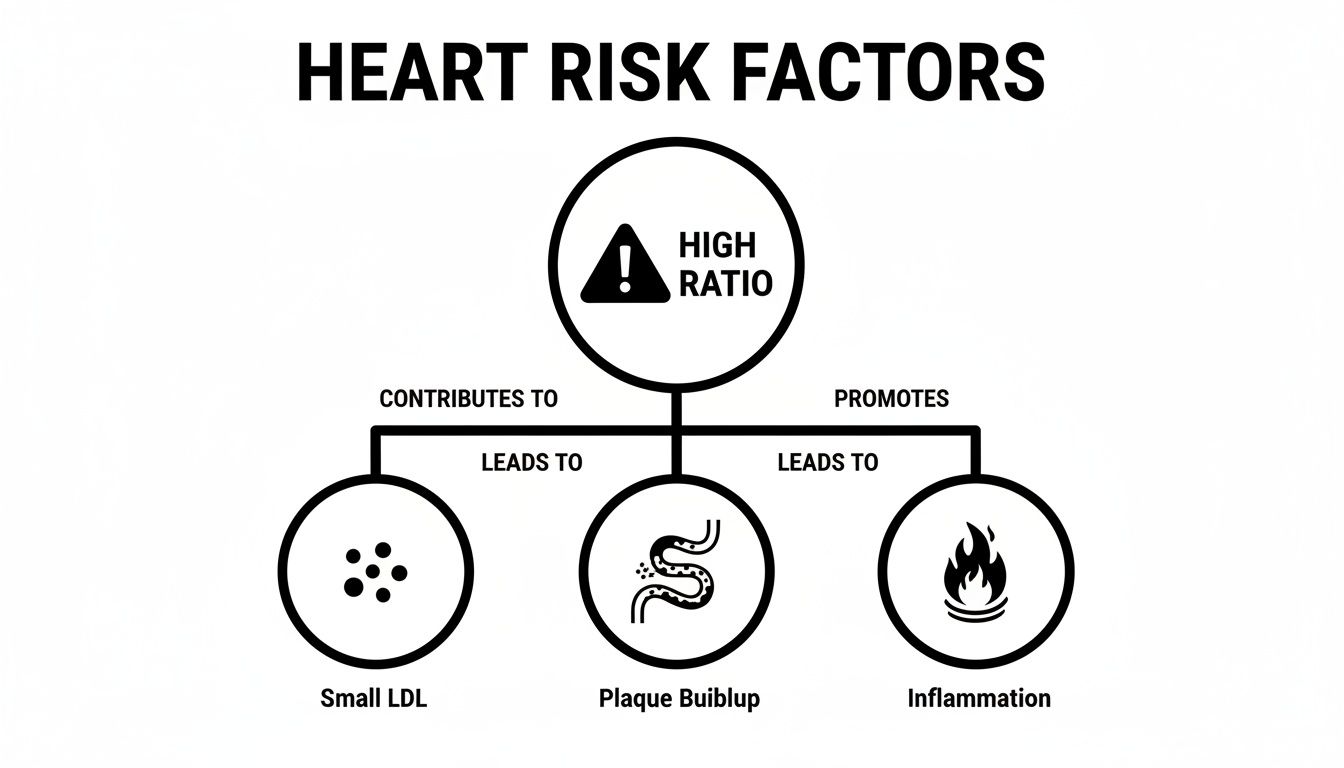
As you can see, a poor ratio is tightly linked to the formation of those nasty small, dense LDL particles, which are much more likely to contribute to plaque buildup in your arteries. It also goes hand-in-hand with the chronic, low-grade inflammation that underpins so many long-term health issues.
Common Factors That Can Skew Your Results
It's really important to remember that your lipid panel isn't set in stone; it's a dynamic snapshot that can be swayed by what you’ve been doing recently. To get a truly accurate reading for your longevity strategy, you need to be aware of the common things that can temporarily throw your numbers off.
The context behind your numbers is just as important as the numbers themselves. Certain lifestyle factors can cause short-term fluctuations, so preparing properly for your test ensures you get a true picture of your baseline health.
Before your next blood test, keep these factors in mind:
- Recent Intense Exercise: A really tough workout in the 24-48 hours before your test can temporarily nudge your lipid levels. It’s best to stick to light activity, like a walk, the day before your sample is taken.
- Alcohol Consumption: Having a drink, particularly in the 24 hours leading up to your test, can artificially inflate your triglyceride levels. For the most accurate result, it's best to avoid alcohol completely for at least a day beforehand.
- Recent Diet Changes: That one high-fat or high-sugar meal the night before can skew your results. It’s important to follow the fasting instructions you’re given, which usually means no food or drink (other than water) for 9-12 hours.
By being mindful of these variables, you can make sure your results are a true reflection of your underlying metabolic state. This allows for a much more meaningful conversation with your doctor about what your HDL:triglycerides ratio really means for your health goals. If you want to dig deeper into all the components of your bloodwork, our guide on what is included in a lipid panel test is a great next step.
Uncovering the Link to Insulin Resistance
Beyond predicting heart health, your HDL:triglycerides ratio tells a much deeper story. It’s one of the best early warning systems we have for metabolic dysfunction, offering a clear window into how well your body is managing its energy and, importantly, how sensitive it is to insulin. This isn't just a niche health metric; it's a cornerstone of long-term vitality.
Think of insulin as the key that unlocks your cells, allowing glucose from your food to enter and be used as fuel. When you consistently eat more energy than you burn, especially from refined carbs and sugars, your body is forced to deal with the surplus. Your liver steps in and converts this excess glucose into triglycerides, which are then packaged up and sent out into your bloodstream.
This puts a huge strain on your system. Over time, your cells can become desensitised to insulin's signal, a state we call insulin resistance. It’s like the locks on your cells have gone rusty; the key (insulin) still fits, but it struggles to turn and open the door.
Your Liver Health and Lipid Profile
When your cells resist insulin, both glucose and insulin levels stay stubbornly high in your blood. The liver, sensing this constant energy overload, doubles down and pumps out even more triglycerides. At the same time, all this metabolic chaos tends to suppress your levels of protective HDL cholesterol.
The result is a classic signature of insulin resistance that shows up directly in your bloodwork: high triglycerides and low HDL.
This is precisely why your HDL:triglycerides ratio is so insightful. It captures this metabolic drama long before your fasting blood sugar ever creeps into the pre-diabetic or diabetic range. An unfavourable ratio is often one of the very first biological clues that your body is losing its sensitivity to insulin, giving you a important head start to turn things around.
An unfavourable HDL:triglycerides ratio is more than just a cholesterol issue; it’s a direct reflection of your metabolic flexibility. It tells you how efficiently you are processing energy, making it a central indicator of your future health and longevity.
Identifying Insulin Resistance Early
Catching insulin resistance early is the name of the game for longevity. It allows you to make proactive lifestyle changes that can completely reverse the condition before it causes lasting damage. The ADDITION-Leicester study, which screened hundreds of UK adults, was instrumental in showing just how effective the TG/HDL-C ratio is for this very purpose. The research found a powerful link between higher ratios and key insulin resistance markers, cementing its value as a simple yet effective screening tool. You can explore the study's findings on ratio cut-points for insulin resistance to see the data for yourself.
For anyone serious about their healthspan - from athletes fine-tuning performance to professionals managing a high-stress life - this ratio delivers actionable intelligence. To dig deeper, check out our guide on how to test for insulin resistance.
Lifestyle Levers to Improve Your Ratio
Improving your ratio really boils down to improving your insulin sensitivity. The great news is that this is almost entirely within your control through targeted, consistent lifestyle adjustments. Let's look at the most powerful levers you can pull.
Lifestyle Levers to Improve Your Ratio
This table breaks down the most effective strategies, helping you prioritise your efforts for the biggest impact on your ratio and your healthspan.
| Intervention Area | Impact on Triglycerides (Lowering) | Impact on HDL (Increasing) | Actionable Examples |
|---|---|---|---|
| Nutrition | Very High | Moderate | Cut back on refined carbs (white bread, pasta, sugar) and increase omega-3s from oily fish like salmon and mackerel. |
| Exercise | High | High | Combine aerobic exercise (running, cycling) to burn triglycerides with strength training to build muscle, which acts like a sponge for glucose. |
| Weight Management | High | Moderate | Losing even 5-10% of your body weight, especially fat around your middle, can slash triglycerides and boost insulin sensitivity. |
| Alcohol Reduction | High | Low | Limit alcohol. Your liver prioritises processing it, which can directly ramp up triglyceride production. |
As you can see, a balanced approach is key. When it comes to exercise, strength training is particularly powerful for improving how your body handles glucose. Simple and effective home workouts using resistance band exercises are a great way to build the muscle that helps keep your metabolism healthy.
By connecting the dots between your diet, your daily habits, and your bloodwork, you can see the HDL:triglycerides ratio for what it truly is: a powerful gauge of your metabolic function and a key to revealing a longer, healthier life.
Your Playbook for a Longer, Healthier Life
Knowing your HDL:triglycerides ratio is one thing; doing something about it is where the real work, and the real reward, lies. This isn't about a punishing, short-term health kick. It’s about making smart, sustainable changes to your daily life that add up over time, building a strong foundation for your metabolic health and, in practice, your longevity.
Think of this as your practical guide to enhancing your healthspan. We'll break it down into four key areas: nutrition, exercise, sleep, and stress management.
Fine-Tune Your Nutrition for Maximum Impact
Your diet is easily the most powerful lever you can pull to improve your ratio, especially when it comes to lowering triglycerides. The strategy is pretty simple: eat less of the stuff that forces your liver to pump out triglycerides and more of the foods that help your body manage fats effectively.
Start by cutting back on refined carbohydrates and added sugars. These are the main culprits behind high triglycerides. We're talking about white bread, pasta, sugary drinks, and most packaged snacks. Every time you swap one of these for whole grains, fresh vegetables, or a source of lean protein, you're directly dialling down your triglyceride production.
At the same time, you'll want to ramp up your intake of omega-3 fatty acids. Think of omega-3s as a targeted strike against high triglycerides. You'll find them in abundance in oily fish like salmon, mackerel, and sardines. Just a couple of servings a week can make a real, measurable difference. For more ideas, check out our guide on cholesterol-lowering foods approved by the NHS.
The goal is straightforward: starve the metabolic pathways that create high triglycerides (fed by sugar and refined carbs) and nourish the ones that support good health (fed by fibre, protein, and healthy fats). This shift alone can have a profound impact on your longevity markers.
Move Your Body the Right Way
Exercise works on your HDL:triglycerides ratio from two angles. A well-rounded training plan uses both aerobic and resistance training to improve both sides of the equation.
Aerobic exercise, things like brisk walking, running, or cycling, is brilliant for burning off triglycerides as fuel. When you get your heart rate up regularly, you're essentially helping to clear excess fats from your bloodstream, which directly lowers your triglyceride count.
Resistance training, on the other hand, is your best bet for boosting HDL. Building lean muscle improves your body's sensitivity to insulin, making it far more efficient at managing blood sugar. This improvement in your metabolic function often leads to a natural rise in your 'good' HDL cholesterol. A mix of both throughout the week gives you the best of both worlds.
Don't Underestimate Sleep and Stress
The effects of sleep and stress on our metabolic health are huge, but they're often overlooked in the quest for longevity. Chronic sleep deprivation and high stress levels can throw your hormones out of balance, increase inflammation, and encourage insulin resistance - all of which will tank your lipid profile.
For example, poor sleep can spike cortisol levels and make you crave sugary, high-carb foods. This creates a vicious cycle that just keeps pushing your triglycerides higher. Your target should be 7-9 hours of quality, uninterrupted sleep each night. Getting into a consistent sleep routine, even on weekends, is one of the most powerful things you can do for your metabolism.
Likewise, chronic stress keeps your body in a constant "fight-or-flight" mode, which can also send triglycerides soaring. Making time for stress-management techniques is non-negotiable. This could be a 10-minute meditation, a quiet walk in nature, or simply blocking out time for a hobby you love.
A Holistic Approach with Targeted Support
While supplements can sometimes play a supporting role in cellular metabolism, they are no substitute for these foundational lifestyle habits. They should always be the finishing touch, not the starting point.
in the end, improving your HDL:triglycerides ratio requires a whole-body view. Each pillar, nutrition, exercise, sleep, and stress, is connected and influences the others. As you make improvements in these areas, you'll find that effective weight management strategies often follow naturally, which is critical for long-term metabolic health.
By adopting these strategies, you're not just trying to change a number on a lab report. You are fundamentally rewiring your body's metabolic engine, cutting your risk of chronic disease, and making a direct investment in a longer, more vibrant life.
Precision Monitoring for Peak Performance
Knowing your HDL to triglycerides ratio is a great starting point, but the real magic happens with consistent monitoring. It's how you actually make progress towards your long-term health and performance goals.
Think about it: an athlete constantly tracks their training data, and a CEO keeps a close eye on key business metrics. Why should your internal health be any different? Tracking is the only way to know for sure if the changes you're making to your lifestyle are actually moving the needle on your longevity goals.
Overhauling your nutrition and training takes serious effort. Without regular testing, you’re flying blind. You're putting in the hard work but have no idea if it's paying off. Precision monitoring turns guesswork into a clear, data-driven strategy. It gives you the concrete feedback you need to stay motivated and make smart adjustments along the way.
This is where a professional service like Lola really comes into its own. We take the hassle out of the whole process, offering gold-standard venipuncture sample collection right at your home or in a clinic. This isn't a basic finger-prick test; it's the same high-quality blood draw used by the NHS, which guarantees 99.8% sample success and the most accurate results you can get.
From Raw Data to Actionable Insights
Your blood sample is analysed at fully UKAS-accredited labs, the same trusted standard used by doctors across the country. But just getting a PDF of numbers is only half the story. The real value is in turning that raw data into a clear picture of your health over time.
This is precisely what the Lola app is designed to do. It lets you:
- Track trends effortlessly: See exactly how your HDL to triglycerides ratio and other key biomarkers are changing as you adapt your lifestyle.
- Access results anytime: Your full health history is stored securely on your phone, making it simple to review your progress whenever you want.
- Download your data: You can easily share detailed reports with your doctor, trainer, or nutritionist, creating a truly collaborative health team.
This continuous cycle of testing, tracking, and tweaking is what drives genuine, lasting improvement.
The Power of a Personalised Review
Perhaps the most important piece of the puzzle is context. A set of numbers on its own can be confusing, or even misleading. That’s why every single Lola test comes with a personalised review from a qualified doctor.
Your doctor transforms your results from a simple data point into a personalised action plan. They connect the dots between your lifestyle, your goals, and your biomarkers, explaining what your HDL to triglycerides ratio means for you and suggesting practical next steps.
This professional oversight ensures you’re not just gathering data, but actually using it to steer your health in the right direction. Consistent, high-quality monitoring is the foundation of proactive health management. It allows you to stay ahead of potential issues and confidently work towards peak performance and a longer, healthier life.
Frequently Asked Questions
Getting to grips with the HDL to triglycerides ratio is one thing, but knowing how to apply it is where the real value lies. Let's tackle some of the most common questions to help you turn this powerful insight into meaningful action for your health and longevity.
How Often Should I Get My Ratio Checked?
If your numbers are looking great - ideally with a ratio below 0.87—then an annual check-up is probably all you need to make sure you're staying on track. It’s a good, sensible rhythm for monitoring your metabolic health.
However, if your ratio is a bit high, or if you're in the middle of making some big changes to your diet and exercise routine, you'll want to test more frequently. Checking in every 3 to 6 months is a smart move. This gives you enough time to see the real impact of your hard work and allows you and your doctor to adjust your strategy based on solid data, not guesswork. This proactive approach is key to optimising for longevity.
Is It Possible to Have Good HDL but Still a Bad Ratio?
Yes, absolutely. This is a classic scenario and precisely why looking at HDL on its own can be misleading when planning for a long healthspan. You could have a fantastic HDL number, but if your triglycerides are through the roof, your ratio will still signal a problem.
What causes this? It's often down to a diet heavy in refined carbohydrates and sugar, drinking too much alcohol, or sometimes just your genetic makeup. These can send your triglyceride levels soaring, effectively cancelling out the benefits of your high HDL. This is why the HDL triglycerides ratio is such a superior metric—it demands you look at the whole metabolic picture, not just one isolated part.
A stellar HDL level can be completely overshadowed by sky-high triglycerides. The ratio forces you to see the balance between them, which is a much more accurate reflection of metabolic stress and future heart disease risk.
Is This Ratio Still Relevant on a Keto Diet?
Without a doubt. In fact, it’s an incredibly useful marker for anyone following a ketogenic or low-carb diet. These eating styles are designed to slash triglycerides while often boosting HDL, which should result in a fantastic ratio.
Watching this number can be a great way to validate that the diet is working as it should metabolically. If your ratio isn't improving or remains high despite being strict with your keto lifestyle, it could be a red flag for hidden carbs, an excessive calorie intake, or another issue that needs a closer look as part of your overall health strategy.
Ready to stop guessing and start measuring what matters? Lola brings professional, gold-standard blood testing to you, either at home or in a clinic, complete with a personalised review from a doctor. Find out for certain if your hard work is paying off and track your progress with precision. Take control of your health goals with Lola today.
Test This Biomarker at Home
This biomarker is included in our Cardiovascular Health and Core Health 45 — results in 2-3 working days with GP-reviewed insights.
At-Home Blood Testing
Check your levels from home
Professional phlebotomist visit. Doctor-reviewed results in 2-5 days. Track your health with comprehensive blood panels.
→45-70 biomarkers tested · Venous blood draw · From £130